
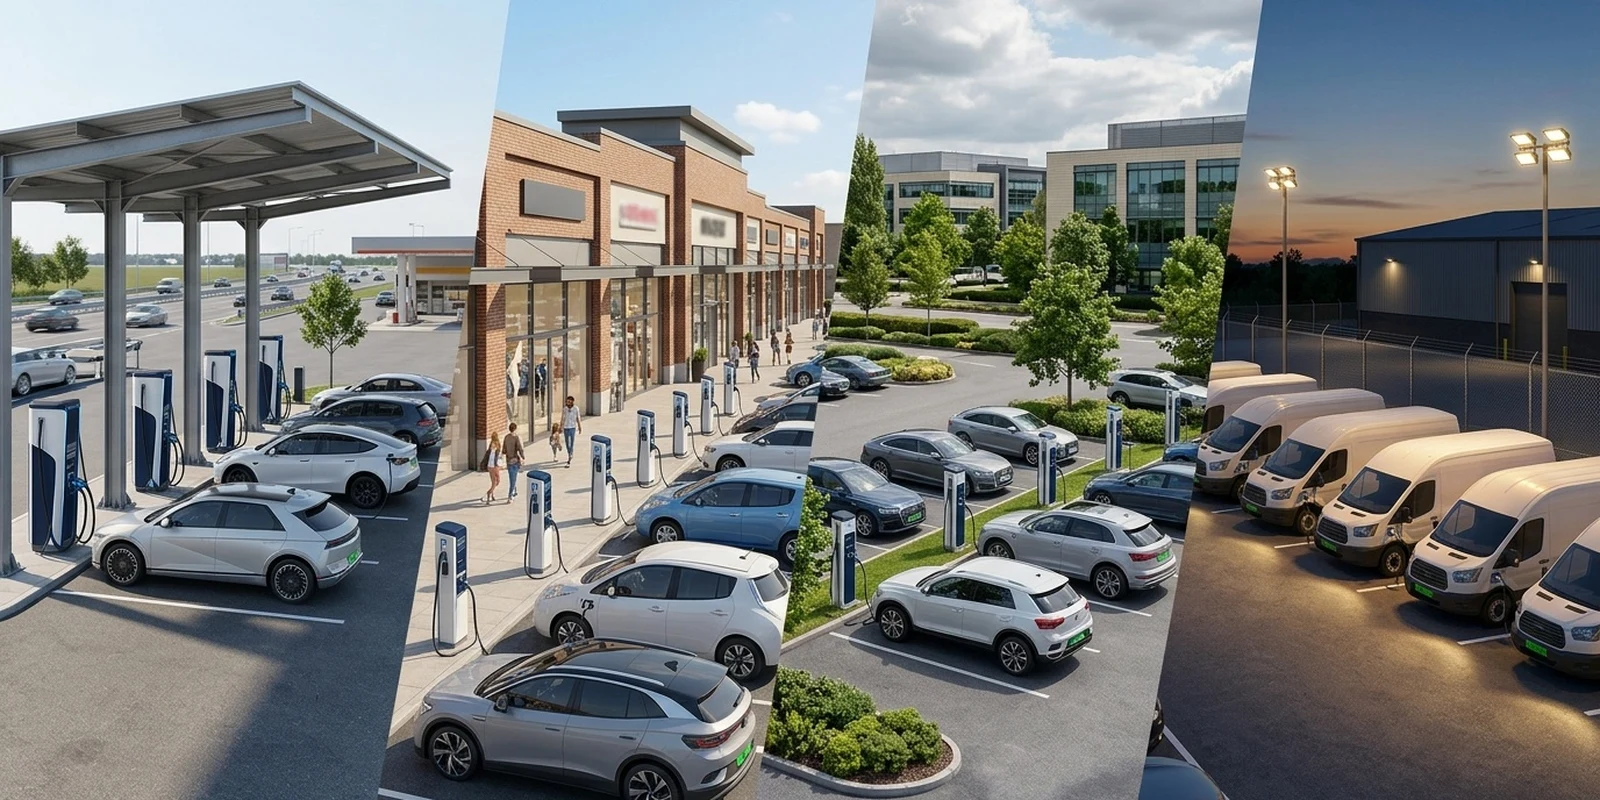
EV Charging Station Profit Margin By Site Type
- Highway DC fast-charging sites run 20–35% net margin once demand charges are actively managed (battery buffering or smart scheduling); below roughly 15% utilization, the same site can lose money at any price per kWh.
- Demand charges alone can consume 23–85% of a DC fast charger’s operating cost — a single 350 kW charger on a $20/kW demand tariff can post roughly $7,000/month in demand charges before a session is even billed.
- Malls and workplaces can hit 40–60% net margin on the charging line at 60%+ utilization with low demand-charge exposure — but many of these sites are underwritten as an amenity (dwell time, footfall, CAM recovery), not a standalone profit center.
- Fleet depots aren’t playing the retail-margin game at all. Electricity and demand charges already make up 30–50% of an electric truck’s total cost of ownership, so a depot’s “margin” is cost avoided against public charging, not gross profit %.
- The amortization horizon you pick moves the math on its own. Spreading identical hardware over 5 years instead of a realistic 8–10-year horizon can swing a site’s calculated margin by several points before a single operating cost is counted.
EV charging station profit margin isn’t one number — it’s a different equation depending on where the charger sits. A DC fast charger on a highway corridor, a Level 2 unit in a mall parking lot, a workplace charging bay, and a fleet depot serving a captive delivery fleet all monetize (or avoid cost) in fundamentally different ways. Treating them as one “is EV charging profitable?” question is how CPOs, real estate owners, and investors end up underwriting a site on the wrong assumptions. This breakdown is written for exactly that decision: whether you’re a CPO evaluating a new corridor contract, a real estate or retail site owner weighing whether to host a charger, or an investor sizing up a portfolio, the five levers below — utilization rate, demand charges, land/lease cost, hardware amortization, and O&M — are what actually decide whether a site clears a real margin, not a single industry-wide average.
What Actually Drives EV Charging Station Profit Margin
Before comparing site types, isolate the five variables that move every charging site’s P&L. Shift any one of these by a few points and the “is this site profitable” answer flips — which is exactly why a single blended margin number for “EV charging” is close to meaningless.
Utilization rate
Utilization is the single biggest lever. Operators generally treat 15–20% average utilization as the floor needed to cover fixed hardware and land costs; a site consistently below 10% is typically losing money regardless of price. The same hardware that loses money at 15% utilization can turn profitable within about three years once utilization climbs past roughly 35%.
Demand charges
For DC fast chargers, demand charges — the utility fee for peak kW draw, billed independent of energy consumed — can account for 23–85% of total operating cost. At low utilization, that fixed fee spreads across very few sessions; at a 150 kW station, cost per session has been shown to fall from roughly $399 at low utilization to $5.73 at high utilization, almost entirely due to demand-charge allocation.
Land and lease cost
Highway sites typically pay land or revenue-share lease tied to fuel-retail economics; malls fold charging into CAM recovery or a revenue-share lease to a third-party CPO; workplace sites are usually a sunk real-estate cost the employer already owns. The lease structure decides who captures the margin, not just how large it is.
Hardware amortization
Charger hardware realistically lasts a few years to over a decade depending on build quality; most commercial operators model an 8–10-year depreciation horizon to match financing terms. Model the same site over 5 years instead, and identical revenue produces a visibly worse margin — a modeling choice, not an operating change.
Operations and maintenance (O&M)
Baseline public Level 2 chargers average around 4 repair visits and roughly $400 a year in maintenance cost per unit. Chargers with strong remote diagnostics have been shown to cut that to about 1.1 truck-rolls a year — a 70%+ reduction in dispatch cost that flows straight to the bottom line without touching pricing or utilization.
Highway And Corridor Sites: Fast Revenue, Thin Margins Without Demand-Charge Control
Highway and corridor sites — the segment most relevant to fuel retailers and oil & gas companies electrifying forecourts — carry the highest revenue per session (DC fast charging commands a premium price) but also the highest demand-charge exposure, since peak power draw is exactly what a fast charger is built to do. Well-run DCFC sites with active demand-charge mitigation — co-located battery buffering or scheduled/smart charging — land in a 20–35% net margin range at good utilization.
The catch is utilization variance. Corridor traffic is trip-driven, not steady, so a site can look strong on a Friday evening and near-empty on a Tuesday morning. Sites without demand-charge mitigation frequently see a 350 kW charger rack up roughly $7,000 a month in demand charges alone under a $20/kW tariff — a fixed cost cleared before margin even starts, regardless of session count.
Malls And Retail Sites: The Charger Itself Isn’t Always The Profit Center
For real estate and retail site owners deciding whether to add charging, the margin question looks different again. Level 2 chargers at high-traffic retail sites with 60%+ utilization and low demand-charge exposure can post 40–60% net margin on the charging line itself — the best per-session economics in this comparison, since L2 hardware is cheap to amortize and avoids DCFC-scale demand charges almost entirely.
That number only tells half the story, though. Many landlords fund and own the chargers as a property amenity, recovering cost through common-area-maintenance charges rather than running charging as its own P&L; others lease the parking footprint to a third-party CPO for a fee or revenue share. Either way, the real return underwritten is often footfall and dwell time — not just margin on the electrons sold. A site owner hosting an EV charging station should model both the charging-line margin and the property-level upside before deciding the deal is worth it.
Workplace Charging: Steady Utilization, But Often A Cost Center By Design
Workplace sites share the mall archetype’s hardware economics — Level 2, low demand-charge exposure, 40–60% margin achievable above 60% utilization — but shift-driven arrival patterns make utilization far more predictable than a retail site’s. The complication: a large share of workplace charging is deployed as a subsidized employee benefit, priced at or below cost, so the “margin” conversation is really about managing a fixed subsidy budget, not maximizing a per-kWh spread.
Where workplace charging is run as a genuine profit center — a campus operator billing tenants, or a CPO managing the site under contract — the same utilization-and-demand-charge math from the mall section applies directly, and shift-pattern utilization is easier to plan around than retail’s weekend-driven traffic.
Fleet Depots: A Different Game — Cost Avoidance, Not Retail Margin
Fleet depot charging is the one archetype here that isn’t really a margin business at all. Electricity and demand charges already make up an estimated 30–50% of an electric truck’s total cost of ownership, so a depot operator’s goal isn’t to price a session for a spread — it’s to keep cost-per-mile below what public charging or the diesel baseline it replaced would cost. That reframes “profitability” entirely: the return is measured in avoided premiums, not gross margin percentage.
Demand charges are arguably a bigger risk here than at a public site, since a depot can have dozens of vehicles plugging in on the same overnight schedule and spiking peak draw at once. On fleets running heavy DCFC utilization, demand charges alone have been estimated at 30–50% of the total electricity bill. Staggering sessions with load management software has been shown to cut demand charges by roughly 30–50% — often the difference between an all-in cost near $0.20/kWh and one closer to $0.35/kWh for the same energy delivered.
Profit Margin By Site Type: A Realistic Comparison
Put side by side, the four archetypes aren’t variations on one margin — they’re four different businesses that happen to share the same hardware category.
| Site type | Typical utilization at maturity | Demand-charge exposure | Primary margin lever | Realistic margin / return |
|---|---|---|---|---|
| Highway / Corridor (DCFC) | 15–30%, trip-driven peaks | High | Demand-charge mitigation, uptime | 20–35% net margin (managed, good utilization); negative below ~15% utilization |
| Mall / Retail (L2 + some DCFC) | 20–40% | Moderate | Dwell time + CAM/revenue-share, not just kWh spread | 40–60% on the charging line at 60%+ utilization; often break-even standalone, profitable at property level |
| Workplace (L2) | 30–60%, shift-driven | Low | Utilization consistency vs. subsidy budget | 40–60% where run as a profit center; many sites are cost centers by design |
| Fleet Depot (mixed L2/DCFC) | 40–70%+, scheduled | High if unmanaged | Demand-charge scheduling vs. avoided public-charging premium | Not a retail margin — electricity/demand charges are 30–50% of vehicle TCO; return is $/mile saved |
How CPOs And Site Owners Protect Margin As They Scale
Every lever above — utilization, demand charges, lease structure, amortization, O&M — is easy to model on a single site and easy to lose track of across twenty. The operators who hold margin as they scale are the ones who can see it per site, not as one portfolio-wide average: which corridor location is bleeding to demand charges, which mall site’s utilization has quietly slipped below its break-even line, which depot route would benefit most from a scheduling change before the next tariff renewal. That’s the practical case for centralizing monitoring, tariff configuration, and load scheduling in a charging management system like YoCharge rather than reading it off spreadsheets updated once a quarter — margin management is an operating discipline, not a one-time site-selection decision.
Frequently Asked Questions
Highway DCFC sites with demand-charge mitigation run 20–35% net margin; L2 sites at malls and workplaces above 60% utilization can reach 40–60%. Fleet depots aren’t a margin business — they’re measured on cost avoided versus public charging.
Demand charges bill a site for peak kW draw regardless of energy delivered, so at low utilization that fixed cost spreads across very few sessions — up to 23–85% of a DC fast charger’s total operating cost.
Roughly 15–20% average utilization is the commonly cited floor; sites consistently below 10% are typically losing money, while profitability opens up meaningfully past about 35%.
Often both. The charging line can hit 40–60% margin at high utilization, but many landlords and employers deploy chargers for footfall or as a benefit, recovering cost through CAM charges or a subsidy budget instead of running it as a standalone profit center.
A public station sells energy at a retail markup. A depot doesn’t sell to the public — it’s a cost center trying to keep electricity and demand charges (30–50% of an electric truck’s TCO) below the public-charging or diesel baseline, so the metric is cost per mile, not margin %.
Track utilization, demand-charge exposure, and O&M cost per site rather than as one portfolio average, and use load scheduling to cap peak draw at depot and corridor sites before the next tariff renewal.
Sources: U.S. DOE / NREL — Public EV Charging Station Utilization | National Association of State Energy Officials — Demand Charges & EV Fast-Charging | ScienceDirect — Economics of EV Corridor Fast Charging | CBRE — Leasing EV Charging Infrastructure
See What Each Site In Your Portfolio Is Actually Earning
Utilization, demand-charge exposure, and O&M cost, broken down per site instead of blended into one portfolio average — see what a platform built for CPOs can show you.